
Bengaluru loves its trees! India hasn’t had its human population census in 14 years now, but here’s our city, doing a tree census. The priorities are clear. I was born and (mostly) live here, and needless to say, these trees are a huge part of my life. Obviously, I wanted to get my hands on this data and see what it says.
A Bangalore Mirror article from November 2024 says that the census data for about 3 lakh trees is accessible at a certain Tree Census Dashboard at the URL https://kgis.ksrsac.in/test/. As expected, the URL presented me with a login gate, and I could not access the data. However, the data was accessible on the OpenCity Urban Data Portal. I downloaded this dataset and ran some exploratory data analyses on it. The data consists of 2,86,780 trees with the species name, zone name, ward number, and geographical coordinates of each tree. As per the news article above, this data is only partial, and more than 15 lakh trees are yet to be counted.
I’m presenting my findings below.
Index
- City-Wide Tree Density
- Zone-Wise Tree Distribution
- Tree Species Distribution
- Popular Trees By Zone
- Unidentified Trees
- Conclusion
City-Wide Tree Density
I divided the city map into small hexagonal bins using Uber’s H3 grid system. Using the geographical coordinates of each tree, I counted how many trees fell into each bin. The result is a heatmap of surveyed tree coverage in the city:
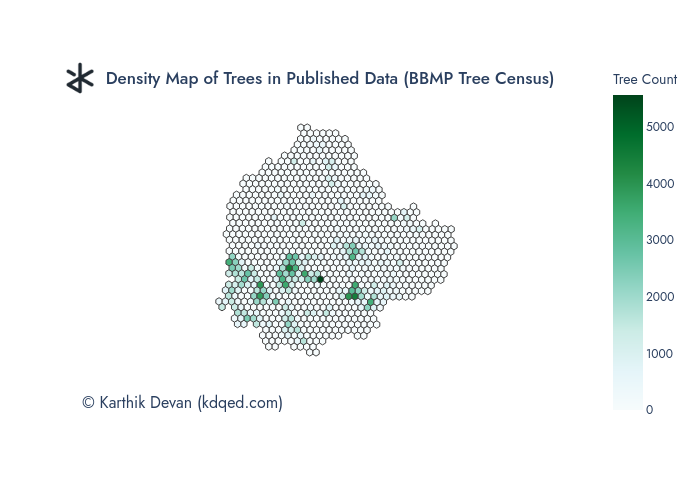
Trees in the data are not evenly distributed across the city. They rather appear in small clusters, suggesting that the survey may be ongoing area-wise. This map does not seem to represent the green cover distribution in Bengaluru yet.
Zone-Wise Tree Distribution
The next thing I explored was how the surveyed trees were spread out across the zones. BBMP has 8 zones, namely East, West, South, Rajarajeshwari Nagar, Mahadevapura, Bommanahalli, Yelahanka, and Dasarahalli.
NOTE: There were no data points from Dasarahalli in this dataset.
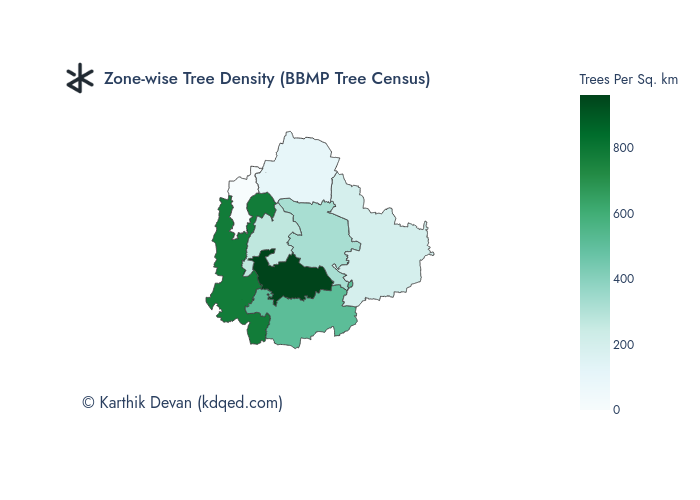
By counting the number of trees in each zone and dividing it by the sq. km. area of that zone, I was able to compute the tree density for the zones. This is shown below, as a map and in a table.
| Zone | Total Surveyed Trees | Trees Per Sq. km |
|---|---|---|
| South | 58652 | 961 |
| Rajarajeshwari Nagar | 90205 | 779 |
| Bommanahalli | 50096 | 513 |
| East | 29803 | 325 |
| West | 13581 | 272 |
| Mahadevapura | 33936 | 198 |
| Yelahanka | 10507 | 106 |
| Dasarahalli | 0 | 0 |
As of now, South and Rajarajeshwari Nagar zones are leading the tree density table, while Yelahanka has the least number of trees per sq. km.
Tree Species Distribution
The data also had a ‘TreeName’ column with the scientific name of each tree. This led me to analyze the diversity of tree species.
The data had mentions of 233 different species of trees, excluding the trees labeled as ‘Others’, which I refer to as ‘unidentified trees’ and discuss in a later section. Unidenfitied trees accounted for 14% of the total. The full list of trees is available here. The most common trees (greater than 1% of total) are shown in the table below:
| Tree Name | Common Name | Count | Percentage |
|---|---|---|---|
| Pongamia Pinnata (L.) Pierre | Honge | 68982 | 24% |
| Others | - | 39565 | 14% |
| Swietenia Mahagoni (L.) Jacq. | American Mahogany | 16313 | 6% |
| Tabebuia Rosea (Bertol) Dc. | Rosy Trumpet | 9690 | 3% |
| Saraca Asoca (Roxb.) De Wilde | Ashoka Tree | 8523 | 3% |
| Cocos Nucifera L. | Coconut Tree | 6597 | 2% |
| Peltophorum Pterocarpum (Dc.) Back. Ex K. Heyne | Yellow Flame Tree | 6232 | 2% |
| Markhamia Lutea (Benth.) K.Schum | Nile Trumpet | 6099 | 2% |
| Terminalia Catappa L | Indian Almond | 6052 | 2% |
| Wrightia Tinctoria (Roxb.) R. Br | Pala Indigo | 5967 | 2% |
| Samanea Saman (Jacq.) Merr. | Rain Tree | 5828 | 2% |
| Acacia Auriculiformis Cunn. Ex Benth | Earleaf Acacia | 4865 | 2% |
| Roystonea Regia (H.B.K) O. F. Cook | Royal Palm | 4013 | 1% |
| Mangifera Indica L. | Mango Tree | 3972 | 1% |
| Ficus Benghalensis L. | Banyan Tree | 3907 | 1% |
| Azadirachta Indica A. Juss. | Neem / Margosa | 3896 | 1% |
| Ptychosperma Macarthuri Nichols | Macarthur Palm | 3865 | 1% |
| Delonix Regia (Bojer Ex Hook.) Raf. | Flame Tree | 3718 | 1% |
| Eucalyptus Tereticornis Sm. | Nilgiri Tree | 3582 | 1% |
| Hydristele Wendlandiana (C. Moore & F. Muell.) H. Wendl. & Drude | Wendland’s Palm | 3579 | 1% |
| Spathodea Campanulata P. Beauv | African Tulip Tree | 3354 | 1% |
| Syzygium Cumini (L.) Skeels | Jamun Tree | 3322 | 1% |
| Grevillea Robusta Cunn. Ex R. Br. | Silver Oak | 3303 | 1% |
| Thespesia Populnea | Indian Tulip | 2963 | 1% |
| Millingtonia Hortensis L.F | Indian Cork Tree | 2887 | 1% |
Pongamia pinnata (Honge) single-handedly accounts for about a quarter of the data. No other tree species is above 6% of the total. Opencity has a similar analysis, and they say this is a pretty diverse distribution.
Popluar Trees By Zone
Combining the above two analyses, I looked at which are the most popular trees in each zone. The top 3 trees in each zone are shown below:
| Zone | TreeName | Common Name | Count |
|---|---|---|---|
| Bommanahalli | Pongamia Pinnata (L.) Pierre | Honge | 16877 |
| Tabebuia Rosea (Bertol) Dc. | Rosy Trumpet | 2588 | |
| Swietenia Mahagoni (L.) Jacq. | American Mahogany | 2375 | |
| East | Pongamia Pinnata (L.) Pierre | Honge | 3884 |
| Markhamia Lutea (Benth.) K.Schum | Nile Trumpet | 3639 | |
| Swietenia Mahagoni (L.) Jacq. | American Mahogany | 2444 | |
| Mahadevapura | Pongamia Pinnata (L.) Pierre | Honge | 4501 |
| Tabebuia Rosea (Bertol) Dc. | Rosy Trumpet | 1706 | |
| Markhamia Lutea (Benth.) K.Schum | Nile Trumpet | 1412 | |
| Rajarajeshwari Nagar | Pongamia Pinnata (L.) Pierre | Honge | 33877 |
| Wrightia Tinctoria (Roxb.) R. Br | Pala Indigo | 5471 | |
| Acacia Auriculiformis Cunn. Ex Benth | Earleaf Acacia | 4446 | |
| South | Pongamia Pinnata (L.) Pierre | Honge | 7182 |
| Swietenia Mahagoni (L.) Jacq. | American Mahogany | 4662 | |
| Ptychosperma Macarthuri Nichols | Macarthur Palm | 3302 | |
| West | Pongamia Pinnata (L.) Pierre | Honge | 2114 |
| Swietenia Mahagoni (L.) Jacq. | American Mahogany | 1614 | |
| Saraca Asoca (Roxb.) De Wilde | Ashoka Tree | 1142 | |
| Yelahanka | Acacia Nilotica (L.) Del. Subsp. Indica (Benth.) Brenan | Babul / Gum Arabic Tree | 1060 |
| Pongamia Pinnata (L.) Pierre | Honge | 547 | |
| Roystonea Regia (H.B.K) O. F. Cook | Royal Palm | 299 |
Pongamia pinnata tops in each zone, except Yelahanka, where it is Acacia nilotica (Babul/Gum Arabic Tree). It is well adapted to dry weather, and this could be a possible explanation of its popularity in Yelahanka.
Unidentified Trees
Around 14% of the trees in the dataset were labeled as ‘Others’ and it is not yet known whether the species names for these trees will be made available. To dig deeper, I determined the zone-wise distribution of unidentified trees, shown below:
| Zone | Unidentified Trees | % Unidentified |
|---|---|---|
| Yelahanka | 7545 | 72% |
| Mahadevapura | 10380 | 31% |
| Bommanahalli | 9820 | 20% |
| Rajarajeshwari Nagar | 6701 | 7% |
| South | 3716 | 6% |
| West | 517 | 4% |
| East | 886 | 3% |
While Mahadevapura has the highest number of unidentified trees, Yelahanka tops the list when we see it percentage-wise. Yelahanka has only ~10,000 of the around 3 lakh trees surveyed, and only ~3,000 of these have been identified. This could either suggest that most trees here are wild and diverse or that there may be operational or skill bottlenecks leading to trees not being identified. Or it could be that the identification is being done by a common off-field team, and they haven’t gotten around to the Yelahanka data yet. This should hopefully be clear when the final data is published.
Conclusion
A tree census by BBMP in Bengaluru is a first-of-its-kind activity, and this is my analysis of the data I could procure. My motivation to do this is my love for the city and its trees (maybe a bit of my love for number crunching too). Special thanks to OpenCity for hosting the data I used in the analysis: the tree census dataset and the BBMP zone boundaries map.
As mentioned earlier, the census is far from complete, and this analysis only gives us preliminary insights. BBMP has not either completed the census or published the full dataset. Whenever the full data is publicly available, I hope to update this analysis.
I used Python for the analysis, and the code is on my GitHub.
Let's Talk!
What do you think about this blog? Mail me at krtdvn@gmail.com